Introduction
Baseball is one of the oldest sports in the United States and is widely considered “America’s Pastime”. The game has changed over the years, but at its core it remains the same as it was when Major League Baseball (MLB) was founded in 1903 (National League – 1876, American League – 1901). Thousands of baseball players have had the privilege of stepping up to the batter’s box, looking out into the stands, and then trying to hit a ball coming right at them. The majority of us are relegated to watching these players live out our childhood dreams. Not necessarily because we lack the passion, dedication, and focus, but because you also have to be highly skilled at the game of baseball. The old saying “Those who can’t do, teach!” comes to mind when thinking about our own love affairs with baseball, but with a slight twist: “Those who can’t play, analyze!”.
Back in the 1900’s (before the internet) fans had to read newspapers to get caught up on the latest stats and box scores. When discussing the top players of the game and/or how those players are getting screwed by the umpires, it required watching a ton of games yourself and talking with tons of other fans (data sources). No matter what, you’d always have some bias thrown into these discussions so unless you are talking about the dominance of Babe Ruth, Mickey Mantle, Ted Williams, or Nolan Ryan. A fan’s impression of an umpire could be made up by a single call they feel they got wrong.
Fast forward to 2021. It’s absolutely incredible how much historical data is available and even more new data is being captured for the first time in 2021. Fan discussions can be steeped in statistics. The funny thing is that even with all of these advanced analytics and immense amount of data, the age-old debates still rage on. Who is the best player in baseball? What makes a Hall of Famer and who among today’s elite will make it to Cooperstown? If Brian O’Nora wasn’t behind the plate in the bottom of the 10th inning of Game Four of the 2012 World Series, would Miguel Cabrera still have been called out on strikes? These types of questions incite debate and lively, endless discussion among fans and baseball pundits. Without a ton of research on your own, you may never get a definite answer… until NOW!
As we created BaseballML.com, we wanted to develop new ways to analyze the game of baseball. There are many sites that analyze the game extremely well (and that we couldn’t possibly match), but there are areas that have been underrepresented. Let’s take a look at umpires for instance.
Statistics like strikeout rate, walk rate, and hit rate have been around for a while but how about going further and looking at how umpires actually call a game? Well, we created a tool that allows you to do just that. With this tool, you can directly compare two umpires and get a nice visual representation of their individual strike zone and even run a direct comparison to see how much more likely or less likely one up is to call a strike. Along the same lines, we also built a model to predict the outcome (Ball/Strike) of a given pitch location depending on many different game conditions (including umpire behind the plate). Now you can see whether going back in time to 2012 with an umpire other than Brian O’Nora makes a difference in the 10th inning of Game Four.
Another discussion that has always fascinated us centers around “Who is the best?” and “Are they a Hall of Famer?” so we decided to tackle this as well. Leveraging some of the incredible work Bill James published, we created a new spin on player similarity exploration to allow interactive exploration of players across different points of their careers. We also built a model to allow you to see an individual player’s progress towards being a “likely” Hall of Famer. This allows you to play back the careers of some of the great players baseball has seen and see when they crossed the “threshold” to becoming a Hall of Famer.
Lastly, we wanted to explore how similar overall teams are created a way to compare two teams across history which leverage individual player similarity within a team atmosphere.
The baseball fan in all of us really enjoyed building all of this because it’s a super fun way to get lost in data and was a great fun setting up the infrastructure. Because we know how much fun we had playing with the data, we also built a mechanism for you, the readers, to download the data we meticulously scraped so that you can play around on your own. Hopefully your inner baseball nerd gets as much out of our creations, as we did while building them!
About this Project
This project began during the Capstone courses for the University of Michigan Master of Applied Science (MADS) Program in the School of Information (courses SIADS-697 and SIADS-698).
Are you considering a degree in data science? Consider MADS, a program from a top-ranked public university. We can vouch for the fact it is rigorous, covers many data science topics in depth, and led by high-quality faculty and staff.
GitHub Repository
Code for this project is stored in a GitHub repository. The README.MD describes the directory layout and location of the various tools.
At this point, the repository is private and we are just sharing with some select members of the community. If you’d like access, send us a note and we can discuss.
About this Blog
This blog is a deliverable for the project, but we also use it to discuss how the project was developed and to provide fellow data scientists with some details of the project that might be applicable in their own work. Hopefully, someone can take advantage of what we learned (for instance, running Streamlit on Heroku) or our dataset of millions of pitches and player data (download and scraped from multiple independent sources).
Let’s get started!
Technology
The primary development environment is Python with libraries familiar to developers including Pandas, Numpy, and Scikit-Learn. Several technologies other than Python were required to run the project.
Deepnote
Deepnote is platform for team collaboration through the use of Jupyter-like notebooks and Kuebernetes virtual machines. Team members can see the edits of other team members in real-time. The platform supports integrations with GitHub, PostgreSQL, and Amazon Web Services (AWS). The free version currently offers 750 hours of free processing time per month. Team members used Deepnote to share and review code.
AWS Relational Database Service (RDS)
The data for the project is stored in AWS RDS in a PostgreSQL instance. Python programs query the database vis psycopg2 library. Database credentials are stored as environment variables and *not* stored in the repository. AWS was often accessed with SQL via PGAdmin.
Streamlit
Streamlit is a Python library providing support for a web-based user interface in Python including widgets and control such as selection boxes, radio buttons, selection sliders, etc. The project uses Streamlit controls in our web-based dashboards and tools.
Heroku
Heroku is a platform for running applications in the cloud and supports Python. Heroku connects to GitHub repositories and deploys applications as specified in a repository. The project uses Heroku to host our web applications.
Deploying Streamlit Applications on Heroku
The Streamlit environment is designed to run applications interactively and requires a particular configuration to run properly. Documentation for running Streamlit applications on Heroku was not readily available. After some trial and error, our team was able to create proper configurations.
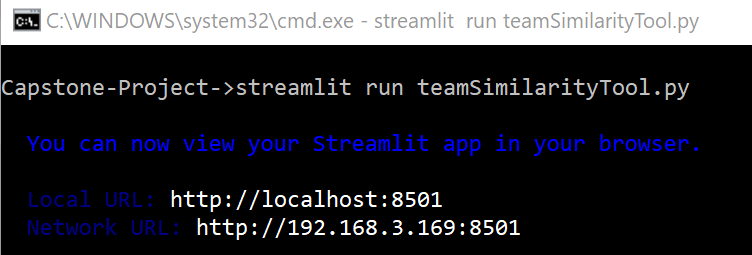
When installed on a local machine, Streamlit does not run in typical Python IDEs or Jupyter notebooks. Streamlit applications are run from a terminal command line:
Because Heroku is a virtual environment, all configuration for Streamlit must be done in configuration files and included in the GitHub repository deployed in Heroku.
Heroku itself requires configuration files. Because it supports multiple programming languages, the specifics of Python must be specified. Heroku requires:
- runtime.txt: For our project, refines the runtime environment (Python) in Heroku
- requirements.txt: For our project, list of Python libraries required to run the Python programs in Heroku.
- Procfile: Used by Heroku to execute commands when the Heroku environment starts.
The Streamlit specific configuration is done in a Bash script and the script is then specified in the Procfile. In this example, there is a script called streamlitSetup.sh:
mkdir -p ~/.streamlit/
echo “\
[server]\n\
headless = true\n\
enableCORS = false\n\
port = $PORT\n\
” > ~/.streamlit/config.toml
This script creates a working directory expected by Streamlit and sets some basic environment variables used by Streamlit in the config.toml file.
The Heroku Procfile initializes the web environment with StreamlitSetup.sh and runs the application in the virtual Streamlit environment with a single line:
web: sh streamlitSetup.sh && streamlit run teamSimilarityTool.py
Other Technology Options
Deployment
Because we like the Deepnote platform for collaboration, we initially investigated using it to deploy the web applications. In fact, it works well but has some particular limitations that caused us to choose another path.
Deepnote applications are run via a Kubernetes virtual machine. These virtual machines can be started manually by running a notebook or scheduled to run automatically. Regardless of how the machine starts, Deepnote times out the machine after 15 minutes of idle time in the free version and up to 24 hours of idle time for paid versions. It would be difficult to schedule a 15-minute restart and we did not want to artificially force the machine to be up for what may be a low usage application, we decided to use the Heroku.
It should be noted that there are other options, including Streamlit Sharing which is currently available by invitation only and looks promising.
Web Interface
We initially chose Anvil Works for use in the web-based user interface. It has a powerful set of web controls, a drag-and-drop form building interface, and powerful object-oriented features. Ultimately, it was simpler to use Streamlit for our applications even though it did not have all of Anvil’s features.
We still like Anvil and one of us regularly uses it for other applications.
Dataset
Data for the project was gathered from multiple publicly available sources and stored in an AWS repository. The data has been made available by various organizations for free, non-commercial public use. The data itself is copyrighted and controlled by those organizations.
We are making the data available to the community in case you would like to replicate our work or perform your own. We hope our work will save you some time. See the Data Download Tool discussion below.
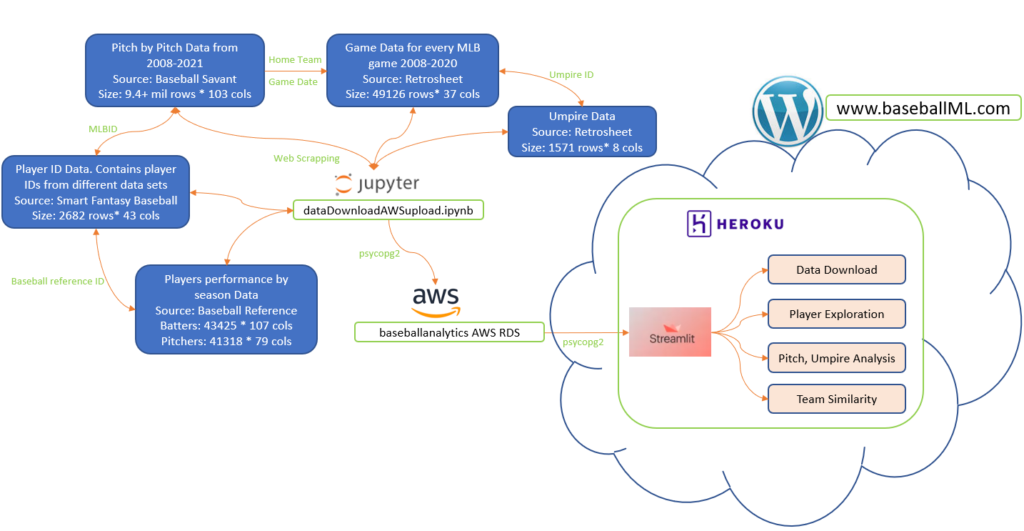
Pitches Data
Pitch data was downloaded from BaseballSavant.com. The site holds information of every single pitch recorded in MLB history. The dataset includes other information including pitch coordinates, pitcher ID, batter ID, pitch result, etc.
Players Data
The players data was downloaded from baseballreference.com. The site hosts information about every baseball player ever played in the MLB. Each player is given a page which holds all the information regarding that player such as height, weight, batting side, throwing arm, teams, debut, career statistics. All the information provided was scraped from the web.
Game Data
The umpire data was downloaded from retrosheet.com. This website contains text files with information regarding all the games played in MLB. Information includes home team, away team, attendance, weather, home plate umpire, etc.
Umpire ID and Player ID Data
Umpire ID information was downloaded from retrosheet.com. Player ID was downloaded from SmartFantasyBaseball.com. Umpire ID maps umpire ID information captured in game table to actual umpire names and their debut information. Player ID contains MLBID and baseball reference ID for any player, MLB ID links to pitches data and baseball reference ID links to player data. The player ID data acts as a link between pitches and player data.
Team Standings
Overall statistics about teams including win percentage and home and away win-loss records were scraped from ESPN.com. Some data cleaning was necessary to align short team names with other data sources and to remove marking only relevant to ESPN.com.
Team Salaries
Data about team salaries was scraped from Baseball Prospectus and stored per team and per year. Some data cleaning was necessary to align short team names with other data sources.
What’s in the on-deck circle?
Our next few posts will get into the details of our baseball analytics tools. Our very next post is about the Player Explorer Dashboard and Hall of Fame worthiness.
Thanks for reading.