Strike Zone Explorer Dashboard
Motivation
“How can you not be romantic about baseball?”
– Billy Beane (from the movie Moneyball)
Baseball is an elegant game. It is even romantic for some fan and players but what seems simple on the outside like batting and pitching, is quite complex to predict. A lot of factors go into what happens to a given pitch. If you are batter, you try to anticipate what type of pitch will come? Should I swing if the pitch is on the border of the strike zone? Where do I like the pitch to be? If you are a pitcher, what zone should I pitch now? Where does the batter strength lie? What speed should I am at? Etc. Even if everything is fixed? How does umpiring change game outcomes? For the same batter, pitcher, pitch type, pitch coordinates, do all umpires call the game similarly?
In creating the Strike Zone Explorer dashboard, we wanted to explore the impact of various game conditions on pitcher, batter, and umpire performance. We believe having all of these together in one place gives unique opportunity to explore various baseball game conditions interactively and rapidly.
Data
This tool uses Pitches, Players, Game, Umpire ID, Player ID data sets together to generate all the required visualizations. Please refer to datadownloadAWSupload.ipynb notebook in the dataDownloadETL folder of the GitHub repository to download/access all the data used in this tool.
The Dashboard
The Zone Explorer tool is divided into three sections
- Batter and Pitcher Profile: Select a batter and a pitcher and explore how their batting/pitching profile changes for different game conditions (balls, strikes, outs when up, pitch type).
- Umpire Profile: Select an umpire and explore how strike zone for the umpire changes for different game conditions. Select a secondary umpire to compare strike zones and explore the differences in umpiring.
- What if I pitch here: Allows the user to dynamically select a pitch location to see the likelihood of different umpires calling it a strike. The tool gives likelihood (%) for different pitch types.
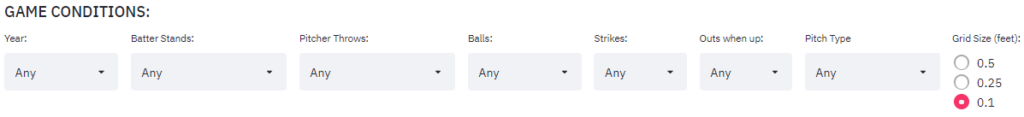
Game Conditions
The game conditions that are configurable in our dashboard are Batter stands (Left, Right, Any), Pitcher throws (Left, Right, Any), Ball count, Strike count, Outs when up, Pitch Type. We feel these are the game conditions that predominantly affect pitch outcomes. We want to explore other factors like home or away, amount of pressure the player is under (score difference), umpire height, batter height etc. in the next iteration of the tool. You can even filter the data to see year by year performance.
Batter and Pitcher Profiles
This section focuses on profiles for the batter and pitcher under given game conditions as shown above. For this analysis, every pitch from 2008 is considered.
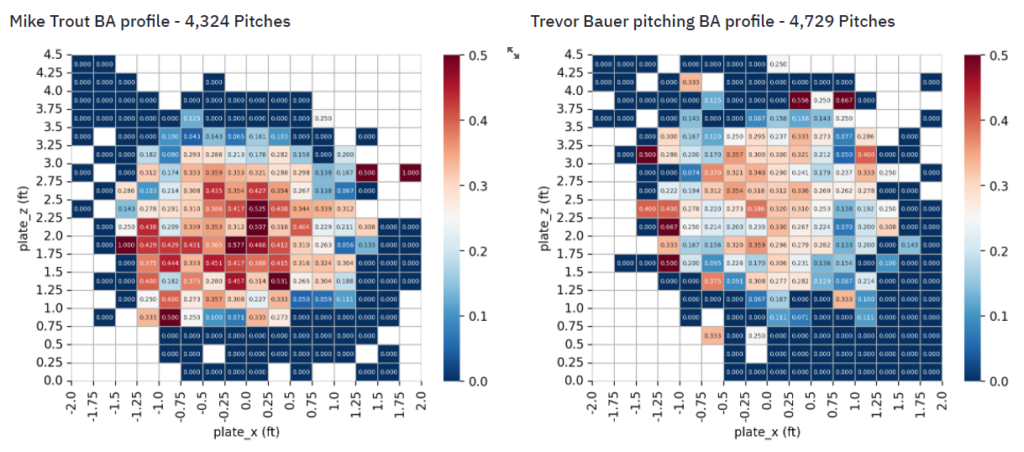
Let’s say Mike Trout is our batter of choice and Trevor Bauer is our pitcher of choice. We filter out all the pitches Mike Trout faced, and all the pitches Trevor Bauer threw. We remove all the pitches that are out of -2 to 2 feet in pitch_x and 0 to 4.5 feet in pitch_z as captured in BaseballSavant.com.
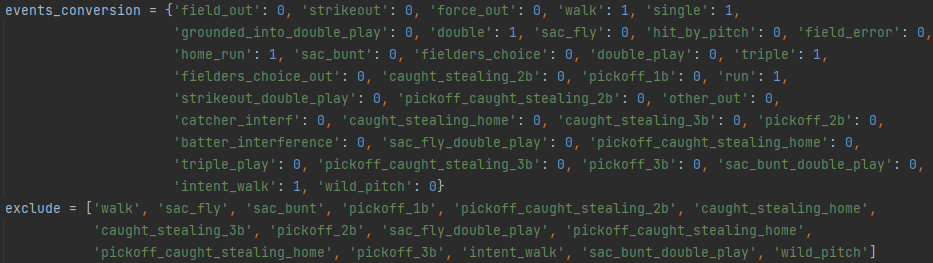
We take the grid size as input and divide the coordinates accordingly. We assign either 0 or 1 to each of the pitch outcomes as shown in the figure. We exclude all other pitch outcomes and then group by the grid size and take average of pitch outcome in each grid. This gives us the Batting Average in each grid for a given batter or pitcher.
This gives us this unique Batting Average profile for a given pitcher and batter at given game conditions.
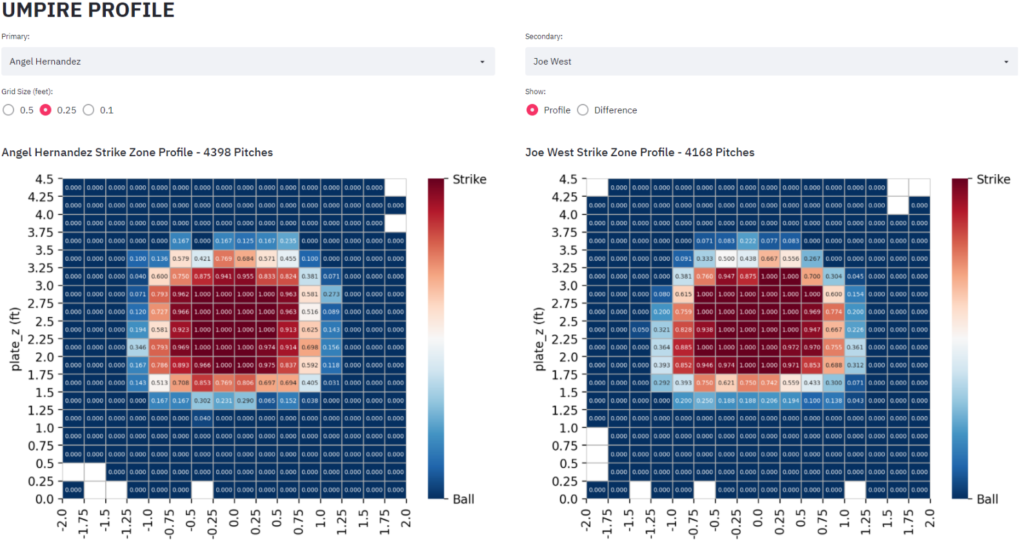
Umpire Profile
We follow the same steps as above to get umpire strike zone, but we filter just ‘called strike’ and ‘called ball’ outcomes. We assign 0 to ball and 1 to strike, group by on each grid, and take the average to get umpire strike zones. The tool allows you to select a secondary umpire to know the difference between strike zone for the two umpires. This is also an area where which side the batter stands changes the profile of the strike zone for umpires.
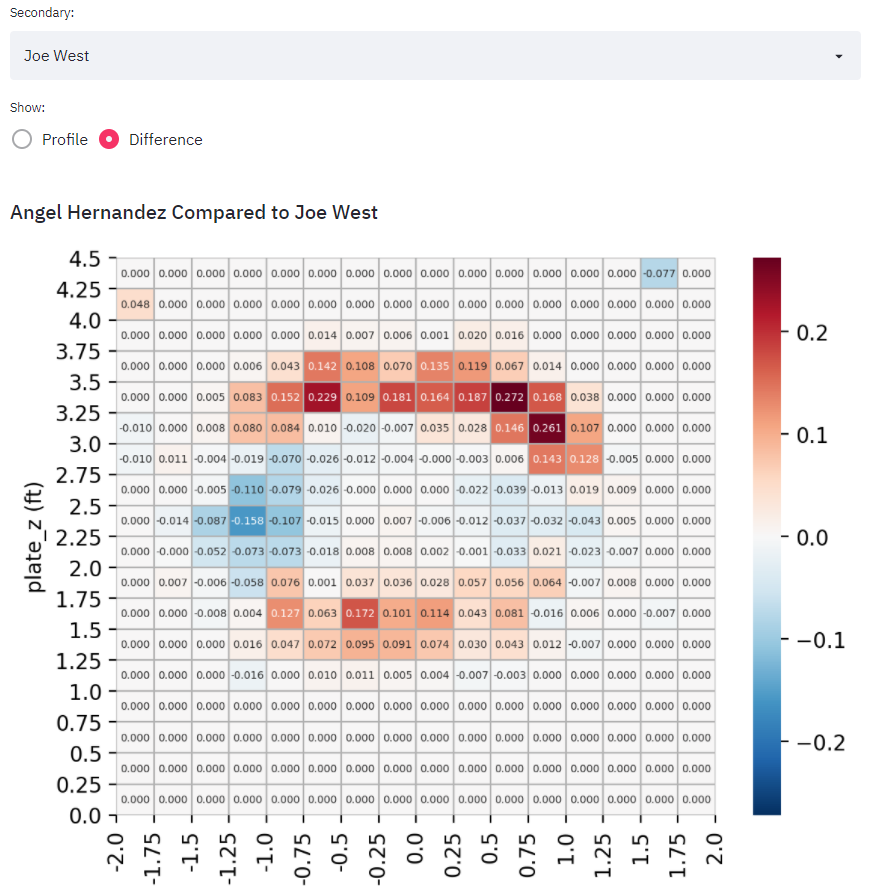
Selecting the difference option highlights the difference in strike zones for the two umpires.
The strike zone is typically called out as knees-to-letters for little leaguers. As players age, the zone tends to shrink and adhere to a rectangle specified by 0 +/- 0.83 feet along the X axis and 2.5 +/- 1 feet along the Z axis. Every player has a slightly different “zone” and how catchers call games also impacts what umpires perceive as strikes.
We included the ability to select different batter/pitcher combinations and see how the umpires “zone” changes in the tool. Typically, umpires call more strikes on the part of the plate closest to the batter as opposed to the part furthest away from them. This is easy to see when analyzing our data.
We also wanted to create a way to visualize how different umpires really are in different areas of the zone. To the right, we can see how much more likely Angel Hernandez is to call a strike when compared to Joe West. As you change grid sizes, you can further refine the differences in 6×6 inch, 3×3 inch, and 1.2×1.2-inch grids. This allows for a fun way to explore how different umpires may be at calling different pitch types, against difference batter/pitcher configurations and along their own careers.
What If I Pitch Here?
This section is a user defined section where user can specify all the game conditions along with user defined choice of pitch location.
Under the hood, the tool filters the data as per given game conditions. A Random Forest model is fit to the given data with pitch types, pitch location and other game conditions as features. Finally, the model takes the defined game conditions as input and calculates the probability of calling a strike at the defined location for different pitch types.
As some filters can significantly reduce the data, we added pitch count in the outcome to show number of samples of each pitch type the model has seen. Generally, the more pitch data fed into the model, the better it performs. Because we wanted to allow for custom exploration, we included a count showing the number of pitches per pitch type used in training the model. The model performs very well across many configurations for fastballs, change-ups, curve balls, and sliders as these are the most common pitches. For less frequent pitches such as knuckle balls, splitters, and others, we can see some varying performance as the pitch counts typically drop faster.
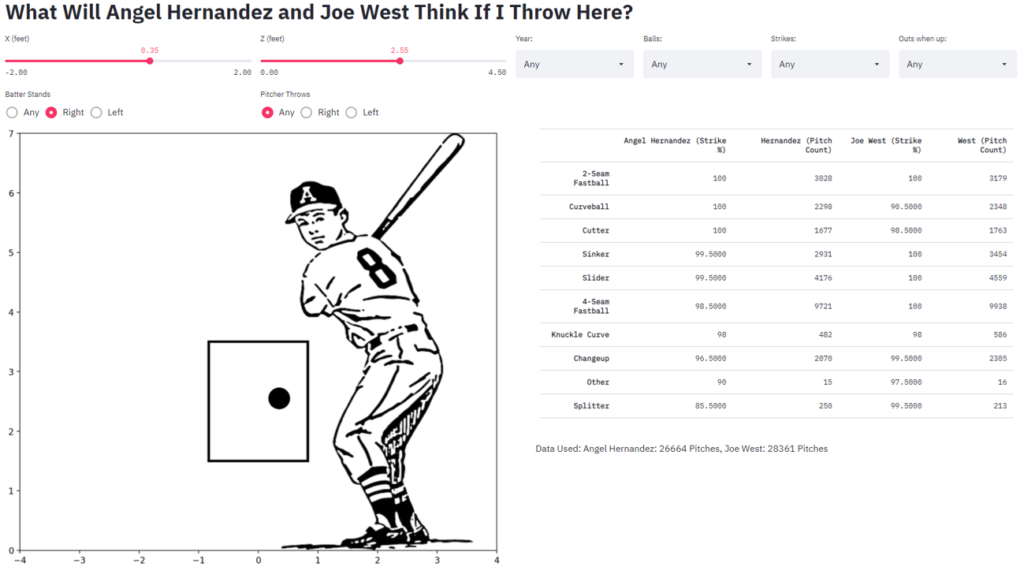
In the image below, we have selected Angel Hernandez and Joe West as our umpires to compare. The parameters selected for this image were an X of 0.35 feet and Z of 2.55 feet and right-handed batters. If you want to look at “Any” batter stance, you will see a wider variance in strike prediction given the effects batter handedness has on outcome. Play around to see for yourselves. For this configuration, we can clearly see that both Angel Hernandez and Joe West are highly likely to call a strike for any pitch type at this location. One spot they differ is if a Splitter were thrown. Joe West has a higher predicted value of calling a strike with these conditions. The coolest thing this does (at least in our eyes) is allow us to playback a previous pitch call from any situation and see if (A) the umpire called it as we would expect and (B) if another umpire might have created a different outcome. The baseball fan in us know that we could leverage this not only to see how consistent an umpire’s performance is relative to a model trained on their past calls, but also just to add fire to water cooler talk among friends. Let us know what you think!
Who’s warming up?
Thanks for reading. We hope you enjoy using the Strike Zone Explorer.
Our next post is about our Team Similarity Tool to compare teams based on player similarity and other statistics.