Baseball Player Explorer Dashboard
This blog discusses out baseball player explorer dashboard, a tool for exploring statistics and information about individual players.
Motivation
We are big fans of the work of Bill James published work detailed in “The Bill James Baseball Abstract” (1986) and “Whatever Happened to the Hall of Fame?” (1995). To learn more about the history of the Baseball Hall of Fame and the many changes the selection process has undergone over the years, we highly recommend reading “Whatever Happened to the Hall of Fame”. In this book, James discusses the need to create metrics to adequately compare players careers to determine whether certain players merit entrance into the hall of fame. In doing so, he created a metric called a Similarity Score which quantifies how similar a player is to another player.
In creating this tool, we wanted to reimagine how player similarities are explored and also create a predictive model that could be used to emulate the thinking of the Baseball Writers’ Association of America (BBWAA) to determine the likelihood of players being inducted into the Baseball Hall of Fame. Babe Ruth is regarded as one of the best hitters in baseball history, but what if he had only played 10 years? Would he have likely been a hall of famer? How many years would he have needed to play in order to likely be a hall of famer? Given he has played only for 10 years, who is he most similar to? Are those players Hall of Fame worthy? Chipper hit above .300 for his career from both sides of the plate, how does his BA compare to Babe Ruth? Which other players had similar hitting profile (‘H’, ‘2B’, ‘3B’, ‘HR’) to Babe Ruth? We wanted to answer all these question with this dashboard.
Data
The data source for this tool is the players data from baseball reference. Data for every single player is scraped from this site and uploaded to the AWS. Please refer to the Batters and Pitchers section of the datadownloadAWSupload.ipynb notebook in the dataDownloadETL folder of the GitHub repository to download the data used in this tool.
The Dashboard
The player exploration tool is divided into four sections
- Individual Info: Select a player of interest and get basic player information and interactively explore player statistics with respect age or season.
- Player Similarity: Explore different ways (Ex. Bill James score, cosine similarity) to get similar players to the player of interest. The tool allows similarity comparison across different age or season segments of the player’s career.
- Similarity Exploration: Select an interesting baseball stat (Ex. WAR) and interactively explore players performance throughout the career. Multiple players can be selected to compare.
- Hall of Fame (HOF) Worthiness: A Random Forest model allows to explore how a player’s HOF worthiness develops over a player’s career. Multiple players can be selected to compare HOF worthiness.
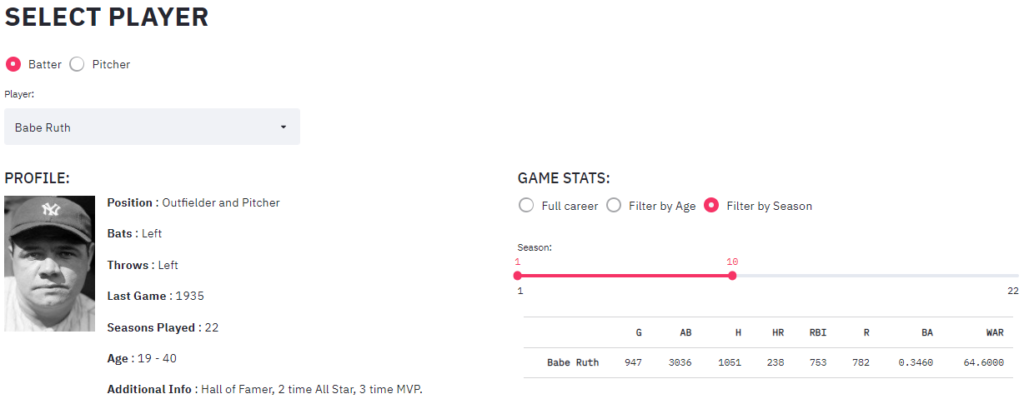
Individual Player Data
This section focuses on a player of interest. The tool provides some basic information about the player and allows the user to interactively see how the player accumulated his stats over his career. One can explore how many home runs did Babe Ruth hit in his first 10 seasons or before he turned 25.
Player Similarity
This section allows to explore player similarity in a number of ways. With its default options it shows the ten similar players to the player of interest according to the Bill James similarity score.
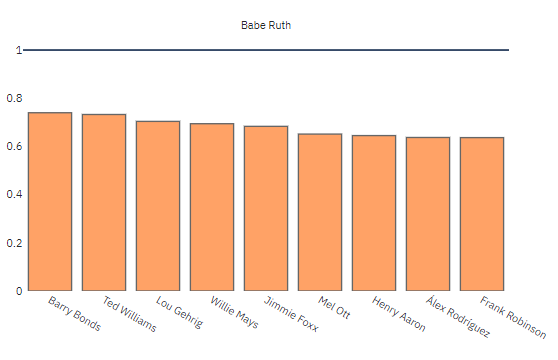
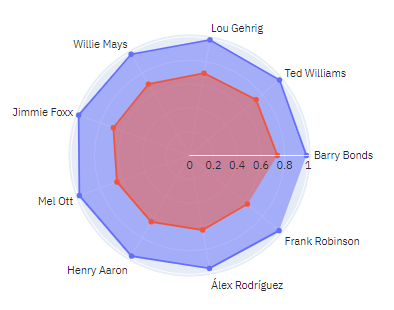
Now what if we want to just look at first 10 seasons and select the players we want to look at. Let’s compare Babe Ruth, Barry Bonds, Henry Aaron, Mike Trout, Paul Goldschmidt, Albert Pujols and Chipper Jones. This is a good mixture of old and new players
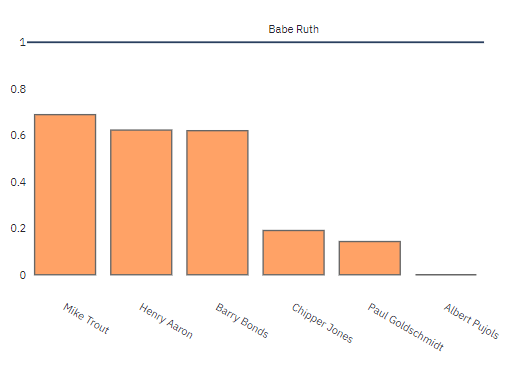
The tool gives you an option to carry over the filtered stats. The tool displays stats in a table for comparison and provides a visualization showing who among the selected players are close to Babe Ruth.
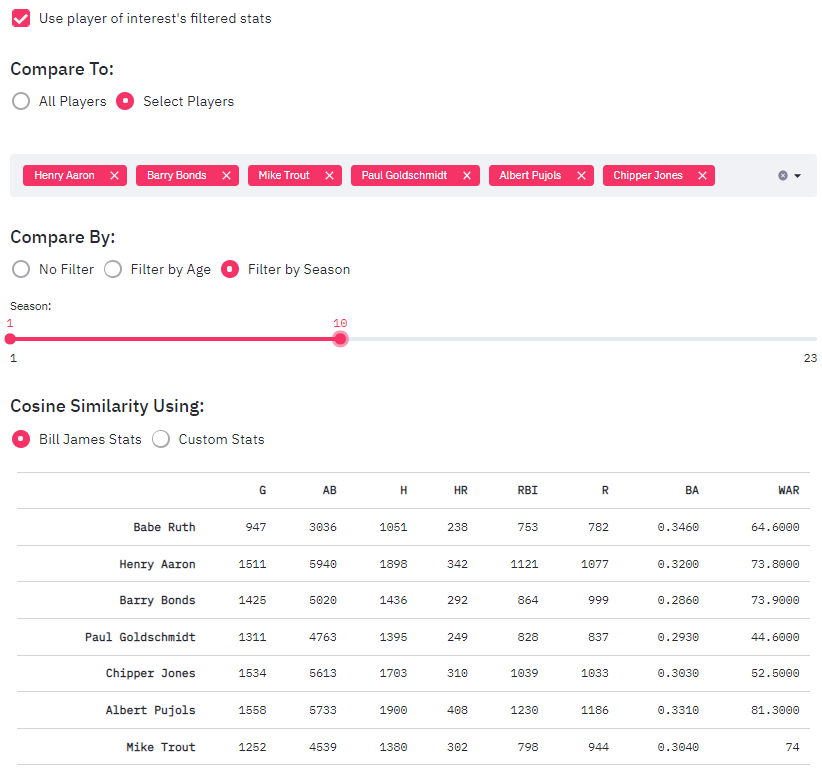
With the stats being displayed, it’s easy to get a picture of where each player is at the end of 10 seasons. We can see Albert Pujols having the most home runs (408), Henry Aaron has the most at-bats, Babe Ruth has the best batting average (0.346).
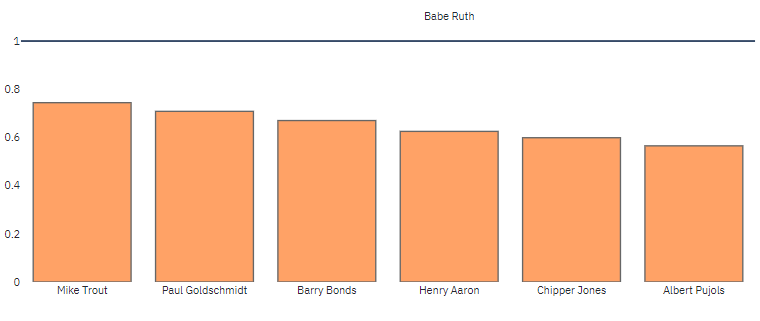
As per Bill James similarity score calculation Mike Trout is the closest to Babe Ruth in just first 10 seasons. Since Mike Trout is an active player and has just played 11 seasons, he is not in the top 10 players similar to Babe Ruth considering the entire career.
Now let’s compare specific stats to see who is more similar to Babe Ruth. Let’s just consider hits, home runs, doubles, and triples. To get the most similar players, cosine similarity on the normalized data using only these stats is considered. The value displayed is the cosine similarity. Users can select to sort by Bill James similarity or by Cosine Similarity.
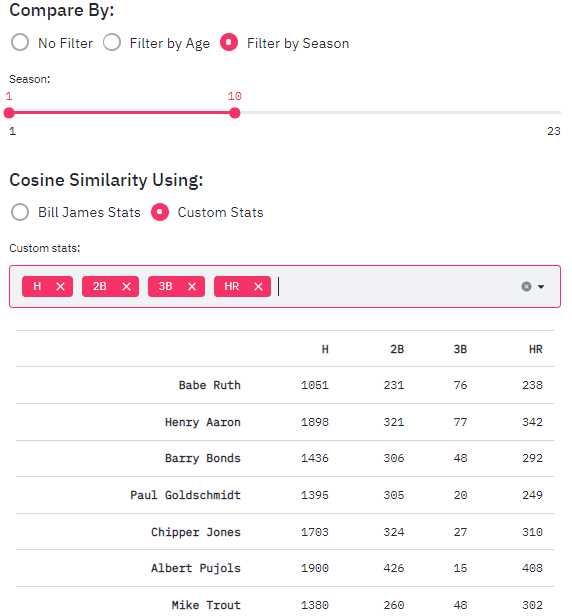
The order changes further, but Mike Trout remains the closest player to Babe Ruth considering these stats.
These methods allow user to explore player similarity in a whole new way that does not exist in current baseball analytics space.
Similarity Exploration
This section allows to do deeper dive into a specific stat and allows user to compare different player’s performance with respect to the stat. Let’s take batting average (BA) for instance.
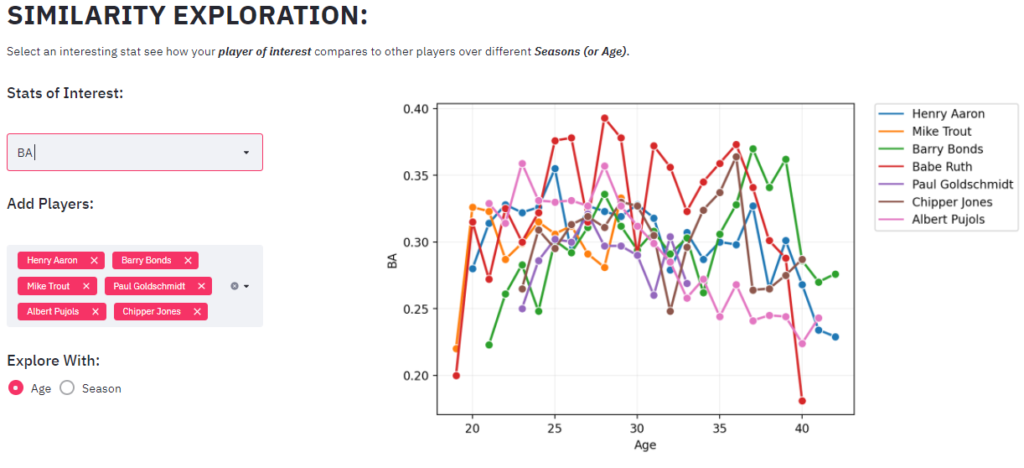
The dashboard dynamically uses the players selected above and shows how BA changes over the season/age of player’s career.
Hall of Fame Worthiness
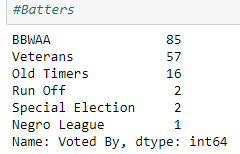
The Baseball Hall of Fame (HOF) has had many paths to becoming a hall of famer since its inception in 1936. The one method which has remained the most consistent is when the BBWAA selects players within a certain number of years after their final game. The veteran’s committee handles players of different eras. Due to the history of the veteran’s committee and their extremely inconsistent methodology for election into the hall, we are focused our model to be based on BBWAA selections only.
Please refer to dataModelling.ipynb notebook in the GitHub repository to get the code used to model the Hall of Fame worthiness.
Five years after a player’s career ends, they become eligible for the BBWAA to vote on induction. They remain on the ballot until they (1) fall under 5% of the vote and fall off the ballot or (2) exhaust their years of eligibility on the BBWAA ballot (currently 10 years). With this in mind, we will use players who last played a game in or before the 2015 season and have been eligible for induction at least 1 year as our train/test set. We will predict HOF worthiness of all current players after the model is built.
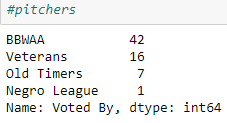
For the pitchers, there are a total of 5776 pitchers in our data set and only 66 players were inducted into the HOF. The breakdown of induction group can be seen in figure. Due to the limited number of positive cases for starters and relief pitchers, we will be focusing on batters only for this supervised model. In our future work section, we will discuss modifications and implementations that could work for pitchers in order to predict HOF worthiness.
Model Selection
Based on the player distribution between those in the hall of fame and those not in the hall of fame, this machine learning problem becomes a problem of skewed classes or imbalanced classes. There are different ways to generate more data for the imbalanced class like Synthetic Minority Oversampling Technique (SMOTE) and others, but due to the unique nature of how different players get into the HOF these methods were not used to augment the data. Player statistics play a role in HOF worthiness, and because of the human element regarding writer sentiment, there could be a major difference between 2,999 hits and 3,002 hits for instance.
We experimented with three types of supervised machine learning approaches to investigate this problem: Support Vector Machines (SVM), Random Forest (RF) and K Neighbors Classifier. We felt these approaches would suit a binary classification problem (HOF – yes or no) well.
Random Forests are known to do well with multiclass classification, so in the future if we wanted to increase the number of classes from two to three or four, we feel RF would be able to handle this better. For instance, splitting the classes into: Definite, Likely, Unlikely, and No Chance. When it comes to interpretability of the results, Random Forests provide good insight into which features are more or less important to the model (feature importance) and generally do not tend to overfit to the training data.
With the correlation present in baseball stats (players with high batting average also tend to have higher on base percentage) we wanted to include SVM as SVMs can be very powerful in determining boundaries between two classes.
K Nearest Classifier was selected because it assumes that similar things exist close to one another. If HOF players are similar to one another, as many pundits believe, the K Nearest Classifier should lend itself well to determining the proper class.
Steps Involved
- Step 1: Split the data into test and training data. 80-20 stratified split.
- Step 2: Use 10-fold stratified CV and get mean F1 Score and mean AUC score for the 10 folds.
- Step 3: Analyze the results (feature importance etc.), check True Positives (TP), False Positives (FP) and False Negatives (FN), think of new features and repeat Step 2 until satisfied. Understand what features work well for which models.
- Step 4: Hyperparameter tuning using grid search.
- Step 5: With satisfied features train on the entire train data and score the test data and examine the results.
Feature Engineering
We went through different phases during feature selection and each phase signifies new types of features tried. Below we have captured some of the different types of features tried.
In phase 1, to start of the model, we just started using some general widely known features such as Wins above replacement (WAR), Home Runs (HR), Batting Average (BA) etc. The model performed okay, the mean f1 score (10-fold CV) was approximately 0.65. Then we used the features popularized by Bill James [G, AB, H, 1B, 2B, 3B, HR, SO, BB, RBI, R, SB, OBP, SLG] and saw the mean f1 score reached to 0.72.
In Phase 2, we decided to add the number of awards won by each player as it would provide more depth on a player’s ability and the recognition they received. We extracted the number of times the player was an All-Star; we extracted the number of times the player was voted as Most Valuable Player (MVP). We did different variations of MVP, like considering any MVP or top 5 MVPs or top 10 MVPs etc. We extracted the number of Golden Glove (GG) award wins. The number of times a player was an All-Star and the number of times the player won any MVP awards, as features improved the model performance to 0.8 approx. The Golden Gloves did not make much of the impact. These award features ranked higher in the feature importance feature of the RF classifier. The dates during which these awards began popping up had a more significant impact on those who received and not those who could not have received so we included them where it benefited the model.
In Phase 3, we observed that different players have different career lengths. Some HOF inductees have a 24-year career, and some have just a 10-year career. Of course, as baseball fans, we understand it is the impact that a player has that counts. To ensure model captures this, we tried a couple of different approaches.
We found the 5 best seasons of a player using the year-by-year data is. For all the important statistical features, we found the best 5 years of all the players. For example, we sum the number of top 5 home runs scored in a year, top five batting average, or top 5 WAR seasons etc. We did this for top 5, 7, and 10 years. This way the model was looking into the best seasons every player had. Upon many iterations features from top 7 years seem to increase the performance the most. Then we thought of consistency, a player will have a higher impact if he has performed at a higher level in consecutive seasons than a few isolated seasons. This could happen due to injury or any other reasons. We extracted the best consecutive seasons a player has had with respect to all the important stats. For example, best consecutive Home Runs, etc. This was again done for 5, 7, 10 consecutive years and features capturing 7 year rolling window slightly outperformed 5-year and 10-year rolling window.
After collecting the rolling features and max period features, we had a way of looking at a player’s “prime”. This refers to the period of time where they are at the top of their athletic performance.
Another thing we needed to take into consideration was the era in which they played. Home runs during the steroid era (1990’s/2000’s) were super inflated when compared to home run totals from the 1910’s/1920’s. Without an adjustment it might just look like players in the early 20th century could not hit for power. What cannot be seen in the data is that fences were much longer back in the day and style of play has shifted significantly to value home runs more than hits.
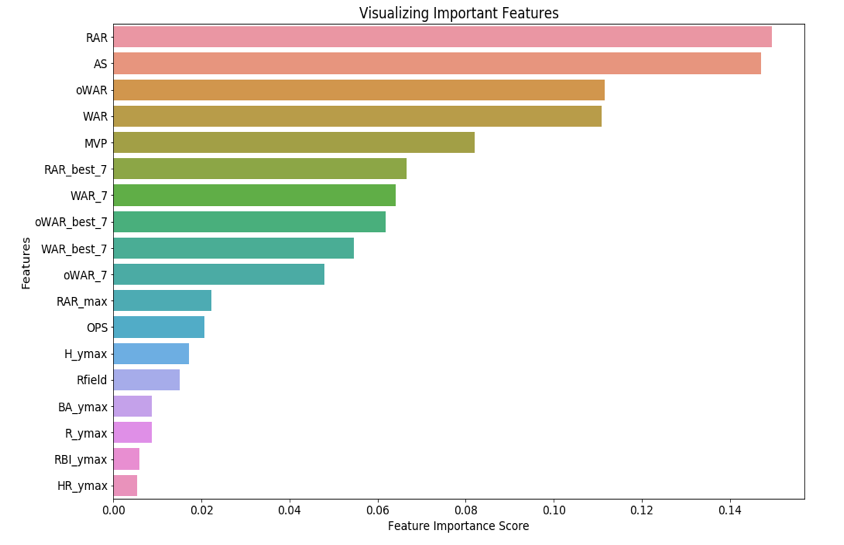
For the next set of features, we extracted the number of years a player was a league leader or in the top 95th percentile of the league for a given stat. For example, in 1919 the max Home Runs by a player was 29 and in 2001 it was 73. We tried to capture which player scored within 95% of 29 and how many such season a player had. This allowed us to adjust for different eras without bias. We also collected more stats that capture the relative performance with the peers. These stats include oWAR (Offensive Wins Above replacement), RAR (Runs Above replacement), Rfield (adjusted fielding metric where 100 is league average). The addition of these features increased model performance and allows us to future protect the model as the adjusted stats will account for gameplay shifts into the future.
Hyperparameter Tuning
After performing a grid search, we found increasing the number of trees from 100 to 200 gives slightly better performance.
Cross Validation Results
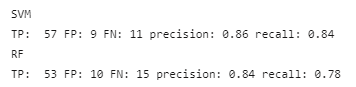
When analyzing our results and failures, we generally liked the performance that we saw. All of the players that belong to a False Positive, False Negative made sense to us. These players all should be in the consideration for Hall of Famer.
False Positives (FPs)
Pete Rose, Barry Bonds, Dick Allen, Manny Ramirez, Sammy Sosa, Todd Helton, Ken Boyer. Several of these players (Mark McGwire, Barry Bonds, Manny Ramirez, and Sammy Sosa) have one thing in common: is that they are widely known/assumed to have used performance enhancing drugs.
For many baseball purists, this would permanently exclude them from hall of fame consideration. They were fantastic players and otherwise would have been first ballot hall of famers. Pete Rose bet on baseball and thus was banned from baseball for life even though he is the all-time hits leader and would be in the HOF easily.
False Negatives (FNs)
Willie Stargell, Ralph Kiner, Jim Rice, Lou Brock, Roy Campanella, Rabbit Maranville, Tony Pérez, Mickey Cochrane, Pie Traynor.
A few of these players are former Negro League players who became MLB players.
Due to this, the model cannot accurately judge their entire career because a portion of their stats are missing. While the model does not label them as hall of famers, they are close to the cutoff and well within discussion. Ralph Kiner has a very short career but was a fan favorite and an excellent player. He has a lot of positive sentiment around his name along with the likes of Jim Rice, Lou Brock, and Willie Stargell. It is understandable that the model does not predict them as hall of famers.
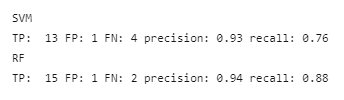
Test Results
On the test set, RF seem to perform slightly well and as there are just 17 positives cases the scores vary a bit with one or two errors. All the FPs and FNs are understandable and are in line with the explanation provided above.
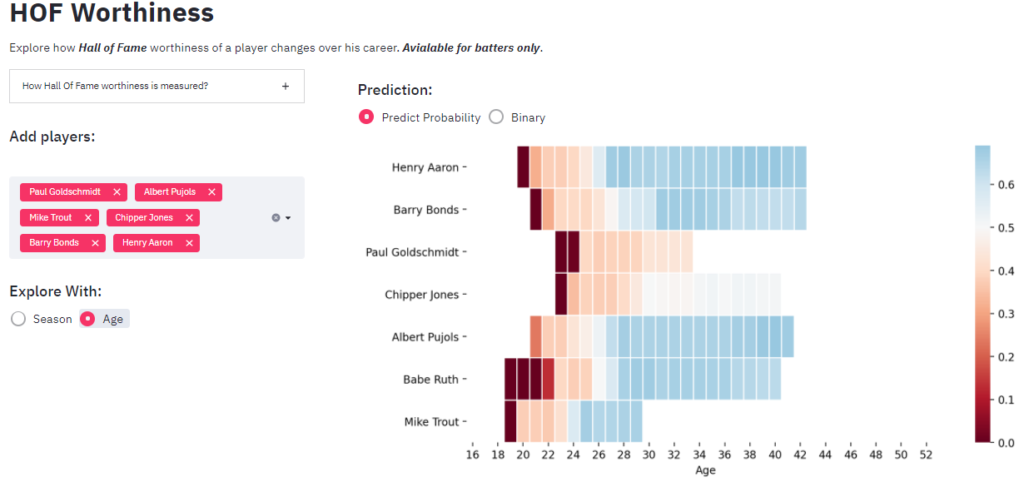
For the visualization we chose the Random Forrest model and applied it on season by season (and age wise) for all the player to get the below visualization in which players can be added and removed. Since most of our features extract values from a 7-year window, we can see some exceptional players achieve HOF worthiness by 7th season, however in reality so we see players have at least 10 seasons.
What’s on-deck?
Our next post will discuss our Strike Zone Explorer, a new modeler for understanding strike zones in actual game conditions with a very cool pitch outcome predictor.